- Interfacing automates workflow of your lab by connecting with instruments.
- High efficiency and accuracy is achieved in reporting.
- Manual data entry errors/typing mistakes are totally eliminated and hence cross-checking / manual verification steps can be easily eliminated. Automatic transmission of data makes error free reports.
- Interfacing brings the results from the instrument directly into your LIMS/HMS software almost instantaneously and thus, it speeds up lab's work.
- Barcoded sample containers will enable identification of each sample to be identified uniquely.
- Automatically transfer/upload orders (test selection) directly to the instrument on patient registration or sample collection from your software. Just place the barcoded samples in the instrument rack/loader and your job is done. There is no need to do sample id and test selection entry on the instrument!
- Turn Around Time (TAT) reduces and reports can be processed/dispatched faster. This implies that lab can process more samples per day in same amount of time.
- Manual record keeping of results in the log book/register can be easily bypassed since all the results of the instrument are stored and readily available on the host computer at anytime.
- Increase efficiency of your instrument with our software. Run more samples everyday, yielding a better throughput.
- Data storage/size constraints of the instruments no longer remains a limitation. Store all the historical results as long as required.
- Interfacing will be truly useful (and often required) for overall compliance and seeking accreditation's.
- Dynamic Formulas for result value unit conversion.
- Connect multiple analyzers on a single host computer and save additional hardware costs.
- Store data into database or export results to external CSV file for external analysis and usage.
- Capture and store QC results.
- Customization available for connecting to any database (MS SQL Server, MySQL, Oracle, Postgres, FireBird, MariaDB etc.)
- Connect & use two or more same analyzer simultaneously on the same network.
- Data is aggregated form different analyzers and saved into a common storage for easy, manageable & centralized utilization.
Graphs and Charting
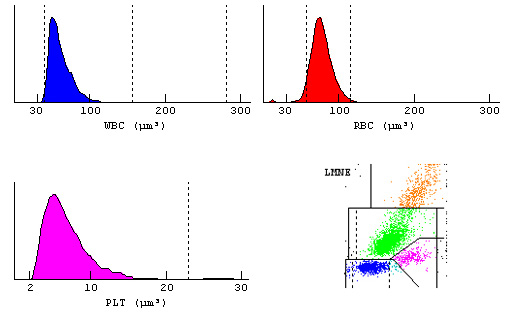
- For hematology instruments, complete CBC/FBP data with histogram / scatterogram & interpretations will be captured and available in reporting.
- Print Histogram & Scatterogram Graphs in colour in the report along with numerical results. Print only WBC, RBC or PLT Histogram on separate page. No need of maintaining separate reports, Give Haemogram and Histogram on single page in beautiful report styles and layouts.
- Histogram and Haemogram graphs are regenerated & re-scaled (where necessary) to fit them on single page report.
- Option for removal of black background in Haemogram / Scatterogram for better print visualization.
- Print Histograms with colours or just outlines.
Reporting and Printing
- Use parameter names of your choice instead of using parameter names assigned by the instrument.
- Report can be printed on your letterhead as per your report header requirements.
- No need of thermal paper prints from the instrument. Print your reports on a paper of your choice.
- No need of attaching & maintaining a separate printer to the instrument; one common printer will do all the work.
- Modify captured data as per your requirement for unit conversion, sample reruns or corrections based on microscope observations.
- Use & print reference ranges according to age and gender.
- Automatic flagging & highlighting of abnormal result values based on the reference ranges.
- Print all parameters or only selected parameters in the report.
- Print Interpretation Flags generated by the analyzer.
- Print additional parameters like ESR / MP along with the CBC report.
Contact
+91 (079) - 4009 2445
Back to Top


